Common App Next Chapter impact update
Common App2025Over the past year, Common App has expanded access to college through new affordability initiatives, direct admissions, and data insights. These efforts have increased usage among students from low- and middle-income communities, showing progress toward reaching our moonshot goal by 2030.
![Smiling woman with curly hair stands against a textured, reddish-brown wall. She wears a gray vest and dark sweater, exuding warmth and confidence.]()
Fiscal Year 2024 annual report
Common App2024Explore Common App's inaugural annual report, showcasing 2024 achievements and our mission to close the equity gap in college admissions by 2030.
![Common App annual report cover page showing a group of students collaborating around a laptop.]()
Equity innovations guide
Common AppMay 2024Learn how we're working toward our mission to expand college access for low- and middle-income students through pilot programs like direct admissions, student context initiatives, financial aid resources, and research collaborations.
![A view of college students working in a computer lab.]()
Equity in admissions
Common AppFebruary 2024Find out about our goal to close the equity gap in students pursuing postsecondary opportunities by 2030. We will achieve this by reimagining college admissions and expanding access through partnerships and innovations.
![A young woman is holding her closed laptop and smiling into the camera.]()
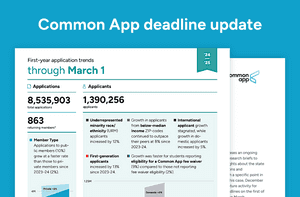
March 1 deadline update
Data Analytics and ResearchMarch 13, 2025First-year college application trends through March 1, 2025, show increases in applicants and applications, with notable growth among Latinx, Black/African American, and first-generation students. Test score reporters are also up for the first time since 2021-22.
![Cover page of the March, 2025 deadline update.]()
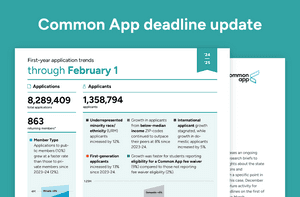
February 1 deadline update
Data Analytics and ResearchFebruary 13, 2025Applicant and application numbers are up through February 1, with Latinx and Black applicants, first-generation students, and low-income applicants showing the fastest growth. The Southwest region saw the most domestic growth.
![Cover page, February 1 deadline update.]()
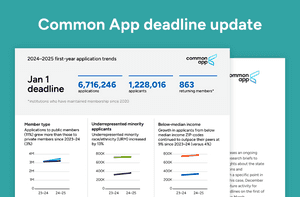
January 1 deadline update
Data Analytics and ResearchJanuary 16, 2025This update shows that applications and applicants are up overall, and growth is fastest among URM applicants. Domestically, growth is most rapid in the Southwest.
![Cover page, January 1 deadline update.]()
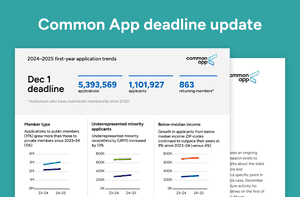
December 1 deadline update
Data Analytics and ResearchDecember 9, 2024This update shows that applications and applicants are up overall and growth is fastest among URM applicants. First-generation and low-income applicants are also increasing substantially.
![Cover page, December 1 deadline update.]()
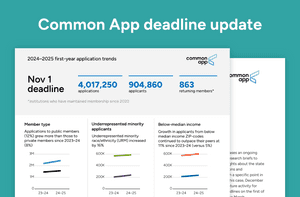
November 1 deadline update
Data Analytics and ResearchNovember 20, 2024The report examines first-year college application trends as of November 1, showing a 6% applicant increase, driven by growth among underrepresented, first-gen, and low-income students.
![Cover page, November 1 deadline update.]()
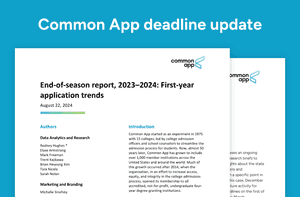
End-of-season report, 2023–2024: First-year application trends
Data Analytics and ResearchAugust 22, 2024This end-of-season report shows 1.4M applicants (+7%) submitted 9.5M applications (+11%). URM applicants rose 11%. Public institutions saw a 16% application increase, outpacing private at 5%.
![Cover page, first-year application trend end of season report.]()
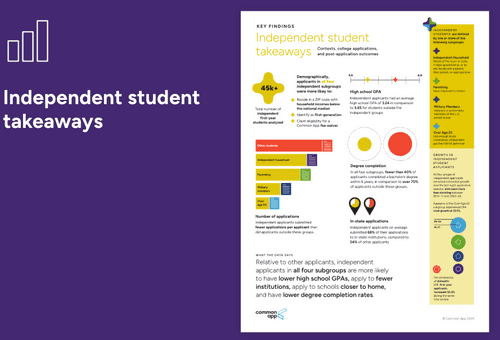
Highlighting independent students’ contexts, college applications, and post- application outcomes
Data Analytics and ResearchMay 12, 2025New research reveals independent students' distinct characteristics, application patterns, and outcomes.
![Screenshot of the report infographic.]()
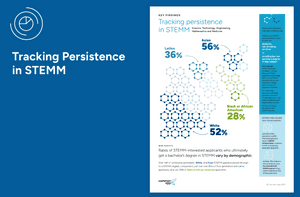
Tracking persistence in STEMM: From application aspirations to college degrees
Data Analytics and ResearchFebruary 24, 2025This brief analyzes the persistence rates of students in STEMM fields, highlighting demographic disparities in degree completion among various racial and socioeconomic groups.
![The cover page of the STEMM report.]()
Research summary: First-year applicant gender and pronoun trends from 2021–2023
Data Analytics and ResearchJanuary 10, 2025Data on gender identity and pronoun use from 2021-2023 was analyzed. Key findings: 2.5% of applicants identified as trans/nonbinary in 2023-24, a 14% increase. Students are increasingly disclosing gender.
![Cover page, gender and pronoun trends brief.]()
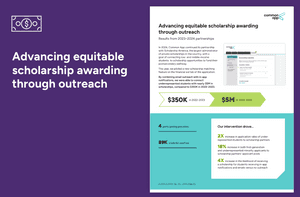
Advancing equitable scholarship awarding through outreach: Results from 2023–2024 partnerships
Data Analytics and ResearchOctober 31, 2024This brief analyzes the results of the partnership between Common App and Scholarship American and the efficacy of the measures taken during the 2023–2024 season to connect underrepresented students to scholarships.
![Cover page, scholarship partnership brief.]()
Advancing equitable scholarship awarding through scholarship outreach partnerships: Results from 2022–2023 partnerships
Data Analytics and ResearchJuly 25, 2024Common App partnered with Scholarship America and Equitable for the 2022-2023 season to boost scholarship access for underrepresented students. Tailored email outreach doubled application rates and boosted scholarship recipients by 5x, leading to $350K in extra funds.
![Cover page, scholarship awarding and partnerships results brief.]()
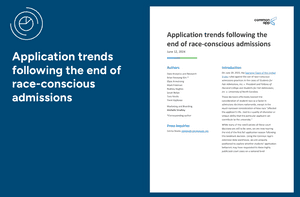
Application trends following the end of race-conscious admissions
Data Analytics and ResearchJune 12, 2024This report examines the impact of the Supreme Court's ruling against race-conscious admissions on college applications via Common App. It finds minimal significant changes in trends compared to prior years.
![Cover page, application trends at the end of race-conscious admissions.]()
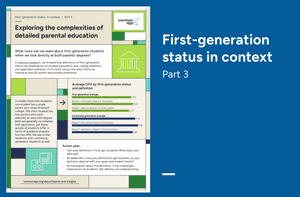
Exploring the complexities of detailed parental education First-generation status in context • Part 3
Data Analytics and ResearchApril 4, 2024We highlight that first-generation status is a simplified measure of parental education and explore the insights gained by analyzing more detailed parental degree groupings.
![Cover page, first-generation status, part 3.]()
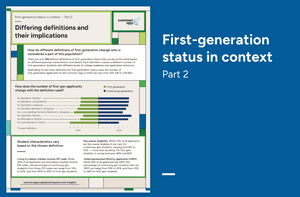
Differing definitions and their implications First-generation status in context • Part 2
Data Analytics and ResearchFebruary 8, 2024We examined how different definitions of first-generation status not only shift student counts but also alter the demographic profile and observed needs of this population.
![Cover page, first-generation status, part 2.]()
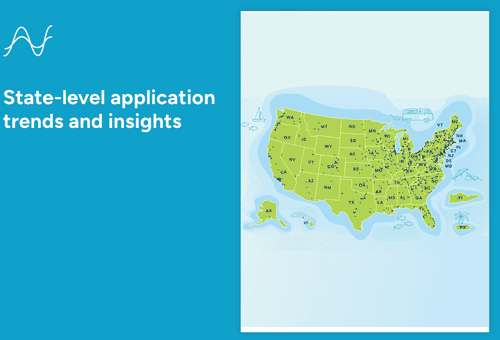
State-level application trends and insights
Common App2024Explore state-specific application trends and demographics for all 50 states, the District of Columbia, the U.S. Armed Forces, and U.S. territories for the 2023–2024 season.
![2023-24 State-level reports]()
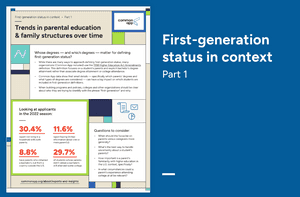
Trends in parental education & family structures over time First-generation status in context • Part 1
Data Analytics and ResearchNovember 8, 2023We explored how small differences in defining first-generation status—such as which degrees and whose degrees count—significantly impact who is classified as a first-generation student.
![Cover page, first-generation status, part 1.]()
Early admission deadlines: Student trends and implications
Data Analytics and ResearchJuly 10, 2023Early applications rose to 58% in 2022-23. Asian and White students applied early more than Black/Latinx peers. Socioeconomic factors influenced early applications more than GPA or SAT.
![Cover page, early admission deadlines-student trends and implications brief.]()
Common App for transfer: a four-year retrospective
Data Analytics and ResearchApril 24, 2023Transfer applicants via Common App are primarily from well-served groups: non-URM, high socioeconomic status, and continuing-generation students. Public flagships and selective universities receive most applications.
![Cover page, Common App for transfer retrospective.]()
Research summary: trends and disparities in extracurricular activity reporting
Data Analytics and ResearchApril 18, 2023Extracurricular reporting reveals disparities. White and Asian applicants report more activities than Black and Latinx. Higher SES applicants report more than lower SES. Disparities are most significant in athletics, academics, arts, and service.
![Cover page, report on trends in extracurricular activity reporting.]()
Beyond 'international': Understanding nuances of a diverse applicant pool
Data Analytics and ResearchMarch 28, 2023International applicants via Common App surged 63%, now 4-5% of all applicants. Applicant traits and behaviors vary widely by country, especially socioeconomic status and application strategies.
![Cover page, brief on understanding a diverse applicant pool.]()
First-year applications per applicant
Data Analytics and ResearchDecember 12, 2022Average college applications via Common App jumped from 4.63 in 2013-14 to 6.22 in 2021-22. High-volume applicants (15+ apps) tend to have higher test scores, apply to selective private schools, and are often international or fee waiver recipients.
![Cover page, first-year applications per applicant brief.]()
Unpacking applicant race and ethnicity, part 2
Data Analytics and ResearchOctober 17, 2022Within standard race/ethnicity categories, substantial disparities exist in applicant resources, college readiness, and application behaviors. Variations within categories often exceed differences between URM and non-URM applicants. Detailed backgrounds reveal hidden diversity.
![Cover page, race and ethnicity part 2.]()
Unpacking applicant race and ethnicity, part 1
Data Analytics and ResearchOctober 17, 2022Focus on standard race/ethnicity categories obscures significant variations. For example, Asian applicant growth (+71%) masks "Other South Asia" surging (+169%), while Japan declined (-4%). Detailed data reveals dynamic shifts and hidden diversity within groups.
![Cover page, race and ethnicity part 1.]()
Long-term progress toward diversifying the Common App applicant pool
Data Analytics and ResearchSeptember 15, 2022Common App applicant volume rose 72% (2013-22). Underrepresented minority (URM) applicants surged 131%, outpacing overall growth. First-gen (+90%) and fee waiver recipients (+110%) also saw higher increases, showing growing diversity.
![Cover page, brief on progress to diversifying the applicant pool.]()
First-year admission plans: trends over time and applicant composition
Data Analytics and ResearchNovember 29, 2021Early admission plans (EA/ED) show disparities. Wealthier, non-first-gen, and non-URM students are overrepresented in early pools. Rolling Admission is most common at less selective schools. Early Decision, though less common, is mainly at selective schools.
![Cover page, first-year administration plans: trends over time.]()
Growth and change: long-term trends in Common App membership
Data Analytics and ResearchOctober 19, 2021Common App membership grew 67% (2014-21), reaching 914 institutions. Public, Southern, and Midwestern schools joined, MSIs more than doubled. URM applicants rose (to 31%), but first-gen applicant growth was minimal.
![Cover page, long term trends in Common App membership.]()
Applying to college in a test-optional landscape
Data Analytics and ResearchSeptember 8, 2021Test score reporting via Common App continues to decline. 45.1% of applicants reported scores as of March 1, 2024, down 1.9% from 2022-23. Trends vary by demographics, with first-gen and URM applicants reporting less often.
![Cover page, brief on test-optional admissions.]()
Pandemic patterns in first-year applications
Data Analytics and ResearchAugust 30, 2021The pandemic deeply affected college applications. In essays, 20% of students shared their COVID-19 experiences, reflecting hardship and growth. Colleges delayed deadlines and went test-optional. Applicants applied later, and test scores were reported much lower than in prior years.
![Cover page, pandemic patterns in first-year applications.]()
A brief guide to Common Apps name, sex, and gender questions for member institutions
Source: Campus PrideMarch 7, 2023Changes to Common App's name, sex, and gender questions are detailed for colleges. Definitions of key terms like legal name, chosen name, and pronouns are given, along with inclusive practice recommendations.
![Cover page, guide to Common App name, sex, and gender questions.]()
Nudging at a National Scale: Experimental Evidence from a FAFSA Completion Campaign
Source: EdPolicyWorks - University of VirginiaAugust 1, 2019A study involving over 800,000 students examined large-scale campaigns to boost FAFSA completion. The findings revealed no significant impact on financial aid receipt or college enrollment, suggesting that effective local nudge strategies may not scale successfully.
![A son and mother are working together at a laptop.]()
Mindsets and the Learning Environment: A Big Biodata Approach to Mindsets, Learning Environments, and College Success
Source: Sidney D’Mello (PI), University of Colorado Boulder, Angela Duckworth (Co-PI), University of Pennsylvania June 2019The study analyzed 278,201 U.S. students, finding that mindsets and learning environments shape college success. Engagement in extracurriculars and supportive settings correlated with higher graduation rates.
![A young man with headphones sits at a desk doing coursework.]()
A majority of U.S. colleges admit most students who apply
Source: Pew Research CenterJune 2019In 2017, over half of U.S. four-year colleges admitted at least two-thirds of applicants, while only 3.4% had acceptance rates below 10%. Highly selective schools remain a small minority.
![A girl is excitedly looking at her phone.]()
True Merit: Ensuring Our Brightest Students Have Access to Our Best Colleges and Universities
Source: The Jack Kent Cooke FoundationJanuary 2016The "True Merit" report finds that only 3% of students at the most selective U.S. colleges come from the lowest income quartile, while 72% hail from the wealthiest. It advocates for admissions preferences for high-achieving, low-income students.
![A young man is posing in his college graduation cap and gown.]()
Navigating the new normal: How the University of Georgia streamlined the application process and improved student and family communication during COVID-19
Common App2020COVID-19 pushed UGA to join Common App, leading to a 27.5% jump in early action apps. Test-optional policy increased in-state applications by 21% and boosted diversity. Data integration sped up decisions and improved satisfaction for all.
![A young woman is participating in online learing at her desktop computer.]()
